Geoscience information and educational materials
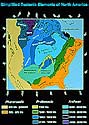
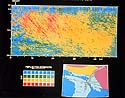
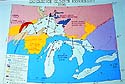
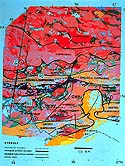
Multidisciplinary studies
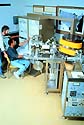
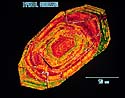
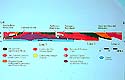
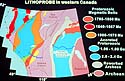
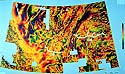
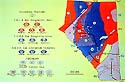
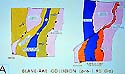
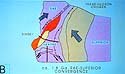
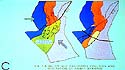
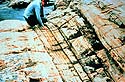
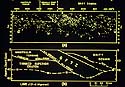
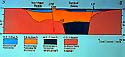
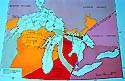
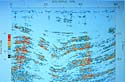
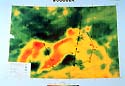
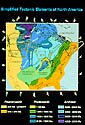
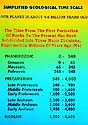
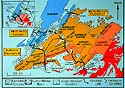
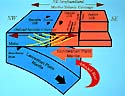
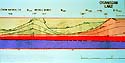
Lithoprobe techniques 12 elephants dancing in unison Seismic reflection method Vibrators Evidence for plate tectonics occuring 2,700,000,000 years ago! What is a terrane?