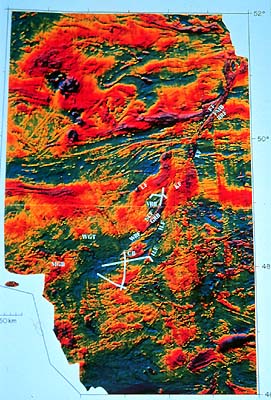
This artificial sunshine and its calculated expression
in shadows, as if the magnetic values shown were an actual surface
relief instead of colours, is a wonderful usage of computer power.
It highlights structural or depositional trends and features. In
this case, the predominant structural expression of the numerous,
roughly north-south trending dykes in the eastern part of the map
was diminished by lining up the imagined sunshine with the direction
of the dykes, so that the dykes themselves would not throw a predominant
shadow.
We can trace the Ivanhoe Lake Fault Zone from the upper right to
the lower left corner of the map. This line is the surface expression
of the west-dipping fault plane along which the rocks from the left
were heaved onto those on the right of the fault line. As we can
see, there are many more features on the aeromagnetic map which
represent the varying magnetic intensities of various faults and
rock units and their orientation. To understand them all would help
get you close to a degree in geophysics.
Before we leave Precambrian times, we should look at another giant
tectonic event, one which almost tore our continent apart. It lies
in the south, in the Great Lakes region, and is called the Keweenawan
Rift System (KRS).
|