We also see the fault plane on the cross section,
where it is shown that the fault flattens at depth, and eventually
peters out.
The upthrust rocks themselves represent a critical period of continental
growth from 2,800 to 2,600 Ma, when a large portion of the craton
formed and stabilized. Now uplifted, the KSZ represents a "window"
through which the architecture and growth patterns of old Archean
continental crust can be seen. Such exposed features can be mapped,
and the physical and chemical properties and ages of exposed rocks
measured directly. Remote sensing methods (such as seismic reflection)
enable us to follow the mapped layers into the depths of the lithosphere.
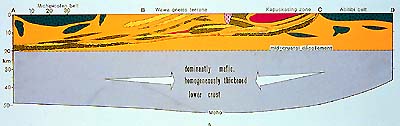
Let's also look at the lowest level shown on the cross section.
It is a geophysically defined discontinuity, the Mohorovicic discontinuity,
Moho for short. [If we consult the supplied glossary we can read
that the Moho is the level at which the velocity of seismic waves
increases rapidly (to 7.8 km/sec.) It defines the crust-mantle boundary.
The depth of the Moho is determined from seismic refraction surveys.]
The Moho tends to be at a relatively uniform depth in each region.
Exceptions can be observed sometimes along critical structural areas,
as is the case here under the KSZ, where the crust (whose bottom
is defined by the Moho) reaches almost 55 km in thickness, or 10
km or more thicker than the regional norm. [Earlier we saw a localized
deepening of the Moho in the Trans-Hudson Orogen cross-section.]
One more look at the stunningly expressive aeromagnetic map of
the KSZ.
|